This story Foreign purchases of American homes plunge 36% as Chinese buyers flee the market went massively viral. It got 2.5k, 6.9k, and 6.1k votes on /r/worldnews, /r/news, and /r/investing, respectively, indicative of immense interest by Reddit regarding trends of foreign purchases of American real estate.
Most notably, and why the story went so viral, is because it pertains to a decline [1] in Chinese buyers:
The Chinese were the leading buyers for the seventh consecutive year, purchasing an estimated $13.4 billion worth of residential property. Yet that was a 56% decline from the previous 12 months and comparatively the biggest percentage drop of all foreign buyers. Chinese economic growth slowed to 6.3% in 2019 compared with 6.9% in 2017, when the previous buyer survey began. The Chinese government also tightened its grip on the outflow of cash to purchase foreign property.
The Chinese may also be souring on U.S. real estate due to the current political climate. Anecdotally, real estate agents in California have seen a pullback in Chinese buyer demand. Southern California had been particularly popular with Chinese parents hoping to send their children to American colleges.
In the first quarter of this year, Chinese buyer inquiries for U.S. properties on Juwai.com, a Chinese real estate site, were down 27.5% from a year ago. Inquiries have been down in four of the last five quarters.
A write-up by Wolf Street goes into further detail.
High-IQ people on Reddit on the aforementioned subs are acutely aware of trends pertaining to China and the US, such as real estate, due to the US-China intellectual connection, which is also a shared narrative and is a reason why the story went so viral. You tell an average-IQ person about this story and their response is likely indifference, because the don’t care that much about Chinese economic data, nor are they buying a home in Vancouver, the Bay Area, or Seattle. Because wealth and IQ are highly correlated, it’s mostly high-IQ Americans who are competing with high-IQ Chinese buyers for these expensive homes.
Regarding the story itself, this seems like more like click-bait hype. People want to believe that Chinese buyers are fleeing the market and that homes will become affordable again (as if homes in the Bay Area were ever affordable). They are not fleeing. Rather, the are buying 30% fewer homes than they were a couple years ago, depending on the time frame you look at.
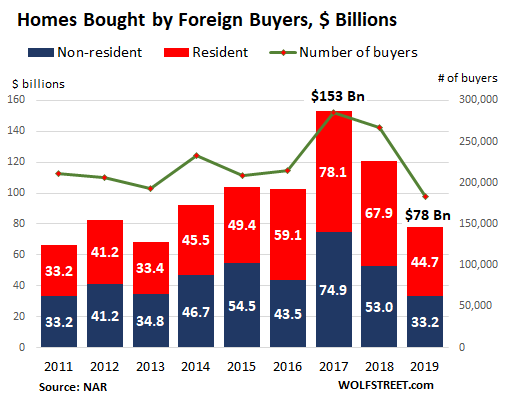
The graph above is somewhat deceptive because these are NOT total sales for the labeled years, but rather sales for an interval that covers the prior year. So 2019 corresponds to the 12 months between April 2018 and March 2019. 2018 is the interval between April 2017 and March 2018, etc. What this also means is that the sales that correspond to this chosen interval may be abnormally low, and it is possible for sales to improve for the rest of 2019.
For example, consider a company sells an average $1000 of widgets per quarter, give or take a couple hundred dollars. Every quarter sales data is released, but on a particular quarter the sales figures are abnormally low. So by choosing the weak quarter as the end-point, the media can publish a sensationalist story about a large YOY sales decline because an abnormally strong quarter from a year ago is contrasted with an abnormally weak one [2]. A monthly breakdown of sales for 2017-2019 would be more helpful, but no such data is supplied.
Purchases by all foreign buyers in the period between April 2018 and March 2019 plunged 36% from the same period a year ago and 49% from the period two years ago, from $153 billion to $78 billion, below the level in 2012 – with purchases by Chinese buyers, the largest group, collapsing by 58%.
Looking at the graph above it’s evident 2017 was an outlier, so we should expect 2018 and 2019 sales to be lower. 2016 sales were abnormally low, which was before Trump came into office, so it’s not like we can blame Trump.
Another reason why this story is mostly hype is because economic data tends to be very volatile and oscillatory, resembling a triangle wave below:

So imagine if the y-axis is data that tends to be seasonal and or has a high variance such as TV ratings, consumer spending, or home sales, and the x-axis is a time interval such as years. So this means that every 2 years (in mathematical terminology, the period of the graph), ratings or sales plunge and journalists can re-run same headline “sales/ratings plunge 40%!” but that is to be expected for data that is oscillatory.
[1] Notably, this concerns the rate of change of the rate of change: a second derivative. Total Foreign homes sold are still increasing on a year-over-year basis, but the rate of increase is declining. The Chinese are still buying a lot of homes, but just not as many of them in the prior few years.
[2] Let’s say a company sells typically $250 of widgets per month. But on Jan, Feb, and March of 2019 it only sold $100/month. By choosing April-March as the YOY reporting period instead of January-December and waiting until the end of the year, the media can report a large decline.