Item #1: I saw this going viral on Twitter:
Some people see “50% of marriages end in divorce” and incorrectly believe this means their own chance of getting divorced, were they to get married, is 50%.
This would be like reading that 35% of Americans have fatty liver disease and believing that you have a 35% chance of…
— Alexander (@datepsych) February 25, 2024
But happy couples don’t wake up one morning and suddenly decide to divorce. By the time the marriage ends in divorce the relationship has already gone to shit well before then. Many couples stay married for the children or financial benefits despite being unhappy or incompatible.
The stat you need: What percentage of marriages reach a point of dissatisfaction in which a divorce is a consideration if the cost of doing so were minimal? That is–not losing half your stuff, no social stigma, no courts, no custody and visitation disputes. You press a button and the relationship is out of sight, out of mind. It stands to reason it must be higher than the putative divorce rate. This shows the importance of path dependency and the passage of time. A divorce is only an end-point or termination of a long process.
@KapitanJames is right:
It's true, people forget to Bayes-update their odds given their own behaviors, but…
50% is a terrible, terrible prior
And when you consider that many couples stay together "for the kids" or because of religion, the number of dead marriages is more like 75%.
— James Marlin (@KapitanJames) February 26, 2024
A second stat: The divorce rate among first-time, never-divorced couples. The divorce rate is likely inflated by people who have had multiple divorces. But even still, the above applies. The most optimistic stat I could find is 40%:
According to the American Psychological Association, approximately 40-50% of first marriages end in divorce. The divorce rate for second marriages is even higher, with approximately 60-67% of second marriages ending in divorce.
Although the data is hard to pin down, by some estimates only 15-30% of couples are happily married, and the majority of couples are chronically unhappy yet stick it out. These are sobering stats for anyone considering tying the knot. Marriage/couples counseling is a huge industry for a reason.
A common misconception is that OnlyFans and Twitch whales are unable to get real girlfriends. This is false; any guy who has enough disposable income to spend thousands of dollars on a stream on a whim should have no trouble getting real girlfriend should he desire one. It’s so that they can set the terms of how much to spend. With a real relationship, that power goes away.
Item #2: It’s Harder to Get Into Harvard than Commonly Assumed
When journalists try to emphasize the relative rarity of landing a job or opportunity, Harvard’s acceptance rate is a common benchmark. Due to Harvard’s exclusivity and name recognition, people assume it’s hard to be accepted, and they are correct. But journalists who use Harvard as a yardstick of exclusivity overestimate the actual odds of getting into Harvard. The published or widely circulated acceptance rate of Harvard (~4% as of 2023) is NOT the same as the odds of being accepted.
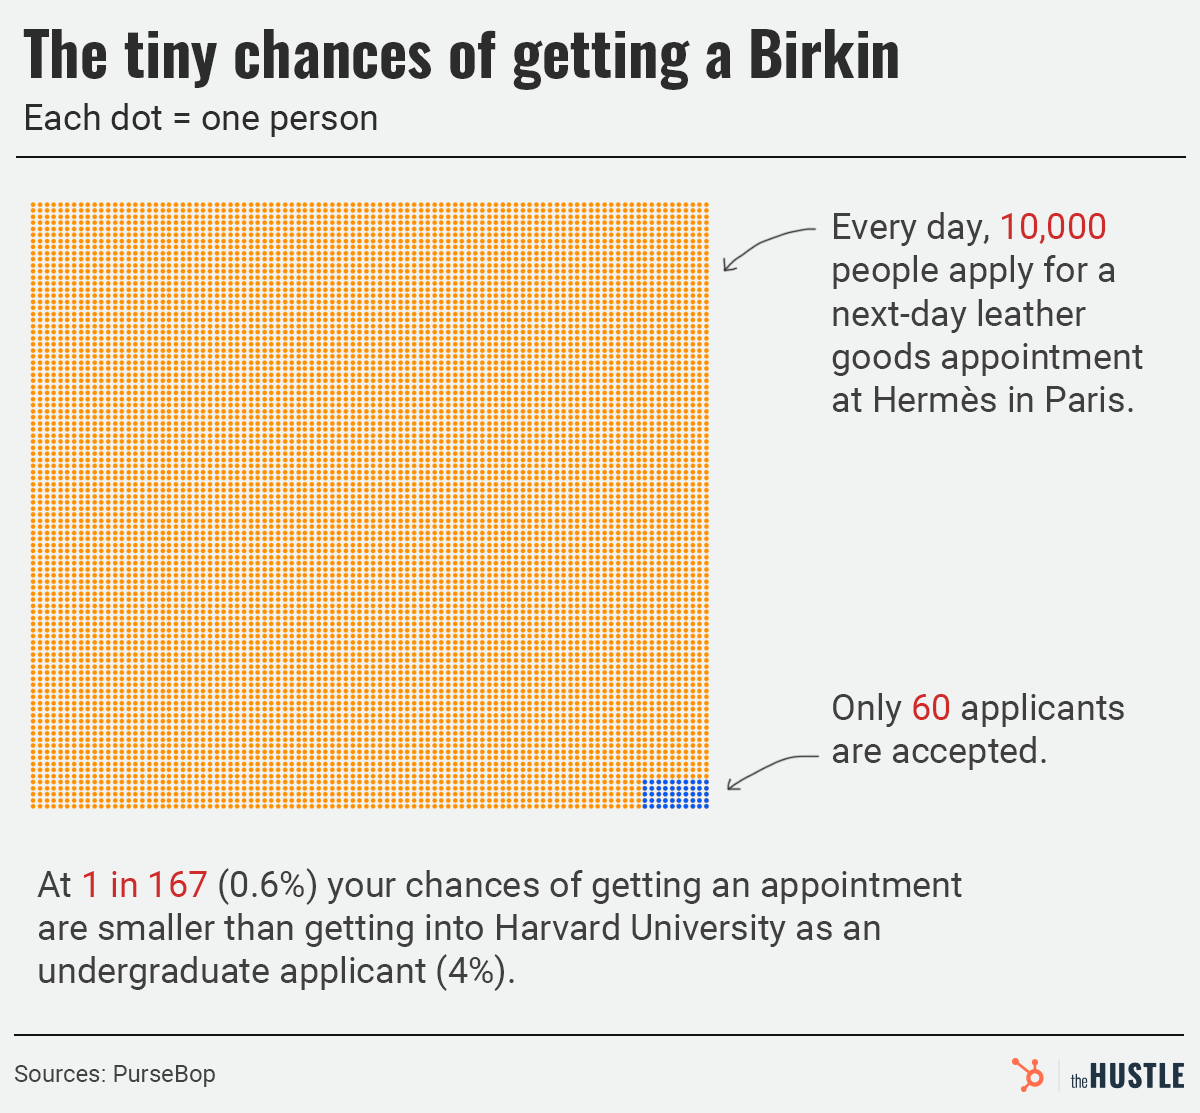
For example, The Hustle reports that the odds of applicants being invited to buy a rare Hermès handbag is lower than Harvard’s acceptance rate, at .6% vs 4%:
Or from Business Insider: 15 things that are harder to get into than Harvard:
Regarding Walmart hiring:
Met with both merriment and protest, Walmart came to Washington, D.C., at the end of 2013.
The store received more than 23,000 applications but hired just 600 associates, NBC Washington reported. That’s a 2.6% acceptance rate — almost twice as selective as Harvard.
While many Harvard graduates can expect a six-figure income, Walmart employees pocket an average of $11.83 an hour or nearly $25,000 annually, according to the company.
Or McDonald’s:
McDonald’s hasn’t gone on a national hiring spree this year, but at one point, it was more difficult to land a job there than a spot at Harvard.
In 2011, McDonald’s held a gigantic job fair. It advertised 50,000 jobs and ended up hiring 24% more than that — 62,000.
One million people applied for positions, which made the odds of getting hired 6.2%.
While Harvard has gotten even more selective, the school accepted about 7% of applicants in 2011.
In 2023, of 43,330 people who applied to Harvard, 1,950 were accepted, for an acceptance rate of 4.5%. So the odds are low. But Harvard applicants are not selected at random from the general population. The high school grad with a low GPA and low SAT score is likely not applying to Harvard, and if he did apply his odds would be lower than 4%.
But applying for McDonald’s or Walmart has no such self-selection bias or penalty, meaning that applicants can be treated as being representative of the general population for statistical purposes, whereas Harvard’s acceptance rate is biased by self-selection effects and thus vastly overestimates the odds of actually getting in.
There is little or no penalty for being overeducated when applying to McDonald’s or Walmart, compared to the penalty of being underqualified when applying to Harvard. Even if there was such a penalty, far more people are undereducated than overeducated.
The vast majority of high schoolers do not bother to apply to Harvard, because, correctly, they surmise their odds are much lower than the widely-cited 4-5% acceptance rate. Of course, there are also high schoolers whose qualifications are commensurate with having at least the stated odds of being accepted, maybe higher, but do not bother applying.
In 2021, 2.3 million freshmen enrolled in a college or university:
Nearly 2.34 million freshmen enrolled in a college or university last semester, a 4.3 percent increase over fall 2021 and a healthy jump from the 2.24 million who enrolled in fall 2020, soon after the COVID-19 pandemic began.
So it’s closer to .085-.087% odds of being accepted to Harvard from a sample representative of the general population. For example, if we assume only 5% of 2.3 million high school seniors who take the SATs score high enough to even have a shot of being accepted, and of those only 2000 are chosen, which gives a .087% probability.
So the stats you need: the probability of getting into Harvard assuming a non-biased sample of applicants. This must be smaller than the self-selected sample.
These two examples show how easily it is to be mislead with stats that are widely reported by the media or taken for granted as true.