All over social media, on Reddit, and elsewhere, everyone is talking about the stock market crash. I keep seeing headlines about the Dow having its ‘worst day ever’ (ignoring the fact that percentage-wise 1000 points is not that much). The S&P 500 is down about 10% in the past two weeks, making this the steepest and worst decline since early 2016. However the overall fundamental picture of the the U.S. economy has not changed despite the selling. My prediction is the market will recover all its losses, possibly no later than April 2018.
Since March 2014 when I launched this blog, I correctly predicted the stock market would go higher. And it has, with the S&P 500 up 35% since early 2014. Had you listened to those who said to sell, you would have missed out on what has arguably been the biggest and longest bull market in the history of stock market. Here are some common arguments for why the market will go lower, which I will refute:
“The economy is weak, because the labor market is weak”
At any time in history, the will always be people struggling. The stock market is generally a better barometer of the health of corporate America and technological innovation, than the well-being of the middle & lower class. Profits & earnings are really strong right now, which is helping the market. From 2009-2012, when the recovery was still in its nascent stage, the biggest mistake pundits and investors made was equating the health of ‘main street’ with Wall St. and corporate America, even though the two are distinct. The health of corporate America has little correlation ‘main street’, except for rare instances like the Great Depression, the mid 70’s, the early 80’s, and the the very depths of the Great Recession. Large companies recover faster from recessions than households.
Another mistake is the fallacy of composition, in wrongly interpreting weak data as being representative of the economy or stock market as a whole, rather than whatever indicator that the data is supposed to measure, that that may only minimally correlated with the market. For example, a low labor force participation rate and low GDP does not imply weak corporate earnings, but rather weakness in the labor market and GDP. This sounds circular, but that is what the data measures, so why should it mean something else. If the data X, Y, and Z measures x, y, and z, why should it measure/imply A, B, C? But because the market cares about profits & earnings first and foremost, it is possible to have a weak labor market and a strong stock market, which is a possibility very few pundits considered. Most pundits fallaciously equated the health of the labor market with the health of the overall economy and the stock market. This is also an example of the Deductive Fallacy. Although the premises “the labor market is weak” and “GDP is weak” may be true, one cannot conclude “therefore, the economy is weak” or “therefore, the stock market should fall.”
“GDP is low”
Yes, although real U.S. GDP is somewhat low relative to historical standards, compared to the rest of the world it’s still pretty good. Second, as discussed above, sluggish GDP does not imply sluggish corporate earnings and overall economy. Indeed, although GDP is only growing at 3%, corporate earnings are seeing double-digit growth, which is why the stock market is so strong even though pundits may say the economy is slow.
As discussed in Optimism or stagnation? A case for both, much of the slowness in GDP can be attributed to declining business investment:
Slow GDP and low productivity are, imho, not that important. Yes, the economy had a real GDP growth rate of 4% in the early 80′s, vs 2.5% now, but to the average person a 2.5% difference is imperceptible. S&P 500 profits and earnings are growing at 10% a year, far exceeding GDP. GDP has four components: Personal Consumption Expenditures, Business Investment, Government Spending, and Net Exports of Goods and Services. Much of the purported GDP sluggishness is due to declining business investment relative to the size of the U.S. economy, which is the least important of the four components. But because profits are surging, so is the stock market, and that’s why it’s not a big deal:

The growing importance of tech and payment processing, which have among the fattest profit margins, strongest monopolies, and fastest growth of all sectors, is indicative of a transition to an economy characterized by higher profit margins and less business investment, because everything is automated. There’s no need to invest when you have a monopoly, huge growth, and 30%+ profit margins. Companies that are labor and capital-intensive are falling out of favor to tech and payment processing.
“The economy is weak”
This is related to above, but overall, the U.S. economy, as measured by a variety of metrics, is strong:
-Low inflation (although there are notable exceptions such as healthcare, education, insurance, and rent)
-Low unemployment. Unemployment is at just 4%, the lowest in decades. (But as many will point out, the labor force participation rate is low, because many people have dropped out and are not counted in the unemployment tally despite not working. Also, many of the jobs created since 2009 are in the low-paying service sector.)
-Profit & earnings at record highs
-Tech is booming; innovation such as apps, drones, electric cars, on-demand entertainment from Netflix, crypto currencies, and so on.
-Housing market has recovered, with some areas higher than they were in 2006.
-Consumer spending and exports at record highs too
“PE ratio is high/market overvalued/market is a bubble”
Since 2013 or so, many investors have lead astray by flawed indicators, such as cyclically-adjusted price-earnings (CAPE) ratio, that purport to show that the market is overvalued. The methodological flaws of CAPE are discussed here. The current PE ratio is 26, although somewhat high by historical standards, is still far from the highs of the late 90’s:
Furthermore, low interest rates, low inflation, and low 10-year treasury bond yields makes stocks more attractive relative to bonds, but also raises ‘real’ earnings, which effectively lowers the PE ratio. 10% annual earnings growth in a 2% inflation environment (such as now) is more impressive than 10% growth with 5-6% inflation (as was the case in the 80’s and 90’s).
How much higher would the market have to rise to be as overvalued as it was in the late 90’s (40+ PE ratio)? Substantially higher. A PE of 40 is 60% higher than the current level of 25. But if earnings are growing at 10% a year and we compound for seven years, earnings will have doubled. So keeping PE constant, prices will double. But then adding a 60% on top of that (for PE multiple expansion) gives a 220% increase.
Additionally, bubbles are only knowable in hindsight, not in real time. As discussed in the post Playing the Financial Bubble Game, by Arnold Kling:
Bubbles are only knowable in retrospect, not in real time. Amazon sure felt like a bubble when it surged from $100 to $200 a share many years ago, but in retrospect given how Amazon dominates retail and cloud hosting and how much earnings have grown, such rapid share price appreciation was justified even though at the time it felt like a bubble.
The present PE ratio of the stock market, or any individual stock, is of scant predictive value. Google in 2005 shortly after its IPO had a PE ratio of 70+, making it overvalued by conventional valuation metrics. It has a PE ratio now of around 25, yet the stock has risen 20x since it’s IPO (that is not a typo).
The PE ratio offers only an incomplete picture of the overall heath of a company. As discussed in Not Worried About Tech Bubble (and how HBD can be used to beat the market), Amazon’s PE ratio is high, but that does not take into account its capital expenditures. When such expenses are removed, profitability improves dramatically. Amazon’s operating margins (in terms of selling stuff) are much higher than its PE ratio suggests. Tesla is another overvalued company that has defied predictions of its collapse. Although it seems like Tesla is losing money for every car sold, it’s car business has 20% profit margins (2x that of Ford and GM), but the losses are due to capital expenditures (such as building new factories), not operating losses.
Although the market may seem overvalued and overextended, if you sell, you may leave money on the table in the form of:
-missed dividends
-the possibility that earning keep rising
-the possibility the market keeps rising, and then even if it falls, it’s still higher than the price you sold
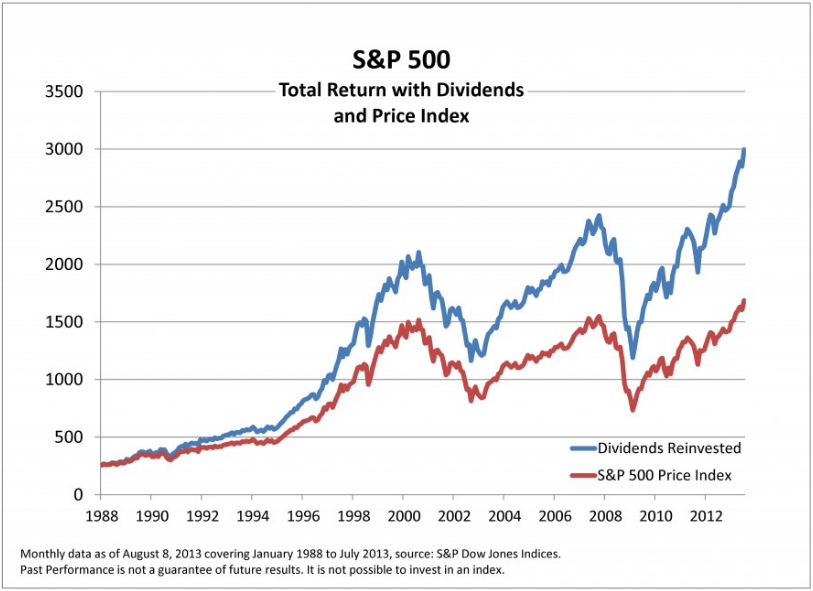
The last reason is why timing the market is so hard. As further evidence of the perils of market timing, had you sold the S&P 500 in early 1996 because it was ‘too expensive’, you would have never been able to buy back at a lower price, ever, even after the crash of 2000-2002 and 2008-2009, and you would have missed all the dividends too. The dividends, as it turns, out are quite important, as shown by the the returns of the S&P 500 with dividends reinvested, versus without dividends:
“There is too much debt”
For countries with reserve currency status and due to insatiable demand for govt. debt and U.S. dollars, this does not matter. Japan has a much higher debt to GDP ratio and has done fine. Govt. spending helps the private sector, as I explain here Economics Myths, Part 1: Budget Surpluses Are Always Good. More govt. spending is pure top-line growth for multinationals and other companies that benefit from govt. and consumer spending, but the debt is postponed in perpetuity. Multinational companies such as Boeing and Walmart can grow at 10% a year due to such spending while the U.S. government only pays 2-3% a year on the debt.
“Too much entitlement spending, student loan bubble, healthcare spending, etc.”
This has been going on for a long time, so it seem unlikely that now it would become a problem when it hasn’t in the past. I agree though that the student loan situation is symptomatic of bad policy, but this is not enough to hurt the economy though. Had someone sold their stocks in 2011 in anticipation of a student loan bubble crisis, they would have missed out on 100% gains later. Because the government owns most of these student loans loans, it’s not as big of a deal than if the private sector does, as was the case with the housing crisis in 2006-2011:

Defense spending helps the defense sector, which is a pretty important part of the U.S. economy. Same for healthcare spending (even though such spending may be symptomatic of bad policy). In 2013 as a consequence of the sequester and defense cuts, the economy was slightly weaker than it would have otherwise been.
“The bull market is old”
Due to low interest rates and strong fundamentals, my prediction is it has further to go. Bull markets do not die of age. There has to be some sort of trigger or catalyst for it to go lower, such as the housing and banking implosion in 2008 or the tech implosion in 2000, but right now there are no such problems on the horizon. That does not mean there won’t be such problems in the future.
“The fed is propping up the stock market”
I refute this in more detail here. The link between QE and rising stock prices may be spurious. The fed began to taper way back in Spring 2013, but the market rallied another 20% in the two years that followed. The market continued to rise after the fed officially ended QE in October 2014. But if the market and economy were entirely dependent on QE, there would have been a bear market and recession in 2013, which obviously there wasn’t.
As shown below, the fed ended their purchases in early 2014 yet the S&P 500 has risen 30% since then:
The market is rising because of huge profits & earnings growth from companies such as Google, Facebook, Boeing, Amazon, Microsoft, Apple, etc. , not because of central banks. Central banks, admittedly, may be playing a small role, but its not nearly as big as the media makes it out to be.
“Geopolitical uncertainty”
Not to belabor this example, but remember all those pundits who in 2016 said Brexit and Trump would be bad for the economy and stock market? They were wrong. Brexit in retrospect was an economic non-event, and the U.S. stock market and economy has done well so far under Trump, with the S&P 500 up 20% since early 2017. That does not mean Trump deserves all the credit, but it shows how popular media narratives tend to wrong more often than not, and how heeding such narratives can hurt your financial health. Other examples include all the hype over government shutdowns, that are of more political symbolism than of economic significance. Despite big headlines and charged opinions, geopolitical stuff just does not move the economic and stock market needle that much. The U.S. economy is huge and autonomous…it’s people buying stuff, companies innovating, etc. No matter who is in power, people will still be clicking Google and Facebook ads. They will still be streaming Netflix, checking their iPhones, shopping at Walmart and Amazon, and using computers with Windows operating systems.
When one zooms out, earth-shattering events like the Kennedy assassination and 911, in terms of market impact is indistinguishable from market noise:


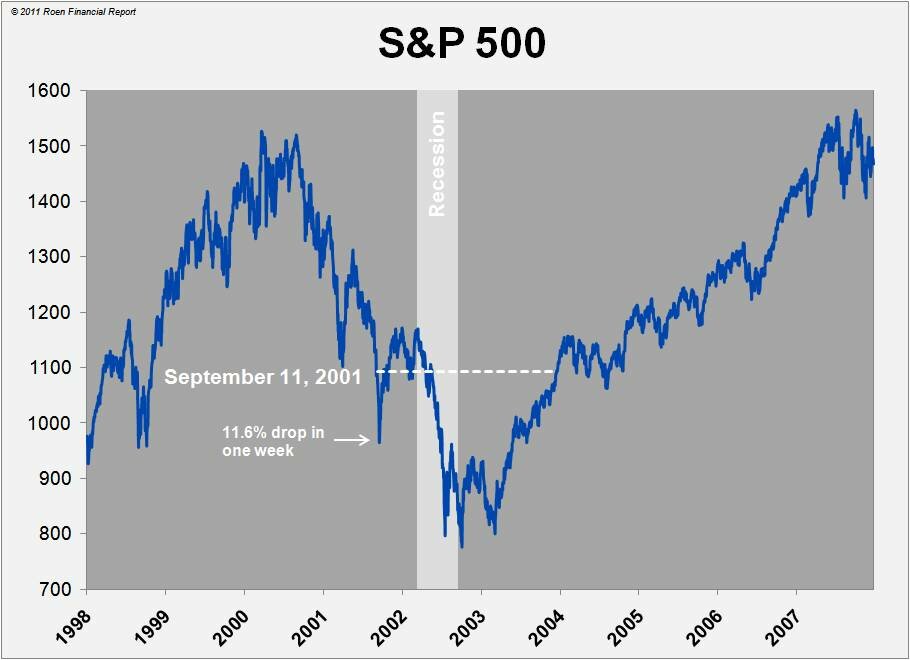
The Dow fell 1,500 points as a result of 911, but it fell 3000 points in 2002 for almost no apparent reason.
Does this list answer all the objections? Not by a long shot. But it at least it answer some of the more common objections.